Data Analysis Tools
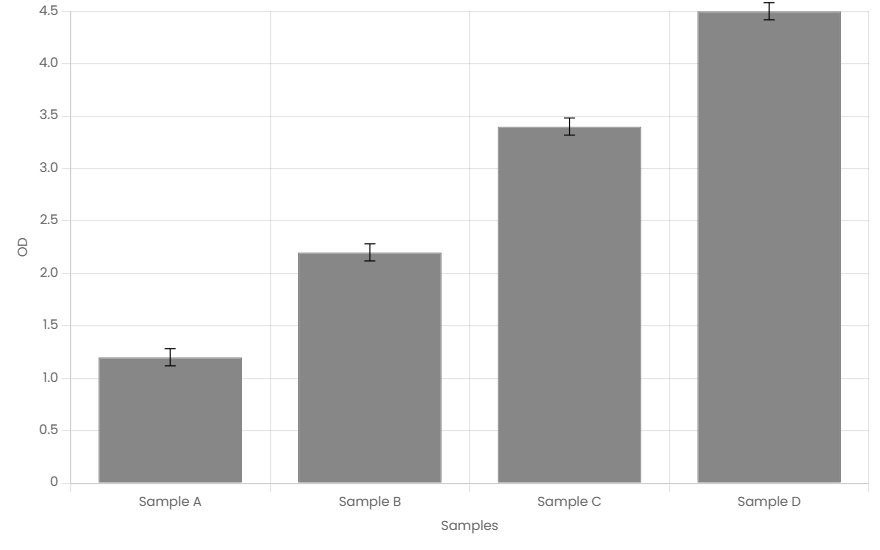
Tools for generating fully-customizable, publication quality data. Client side only analysis tools.📊 Grouped Sample Chart with Error Bars
This is the new and improved version of our charting tool. Input replicate data for multiple samples and automatically calculate averages and standard deviations. Customize bar colors, Y-axis scaling (linear/log), and chart dimensions to suit your dataset. Perfect for ELISA results, protein expression analysis, or any multi-condition assay comparison.
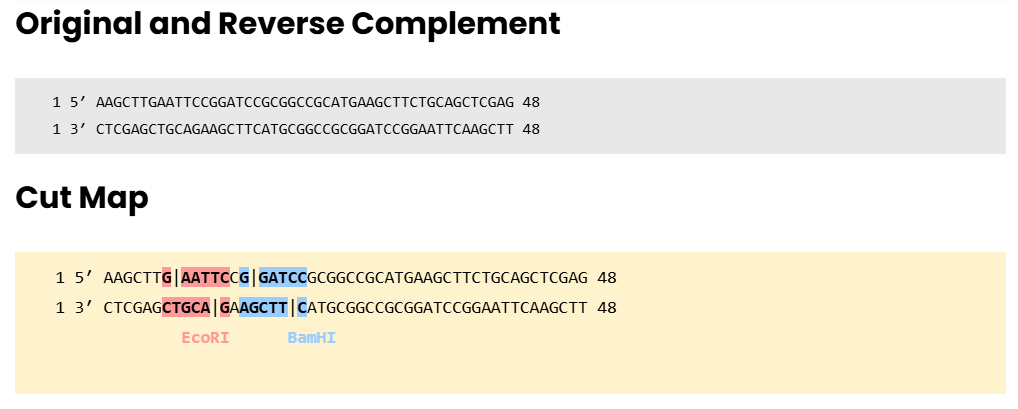
🧬 DNA Restriction Site Analyzer
This tool has been fully updated to help you identify restriction enzyme cut sites in DNA sequences. Paste your sequence, select enzymes, and view annotated cut maps with reverse complement display and translated frames. Ideal for cloning workflows or mutation checks.
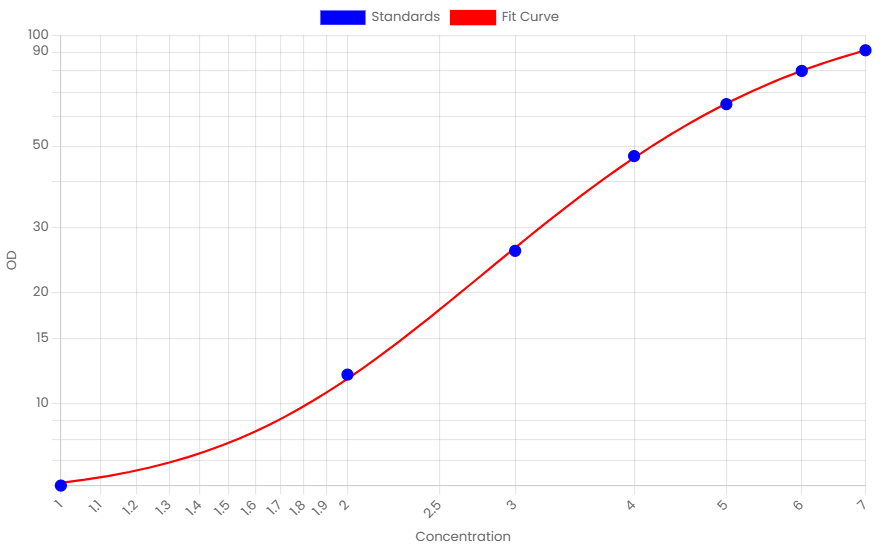
🧪 Advanced Assay Calculator (4PL/5PL)
New and improved 4PL/5PL graphing support is now live. This advanced assay tool fits ELISA curves, interpolates unknowns, and supports full customization of visual output. Use it for IC₅₀/EC₅₀ curve fitting, standard curve visualization, and dose-response analysis.